Javafx Chart("Retail Fuel Pump Prices Feb 2013 to May 2015")
When i start doing my own fun projects i usually end with something totally different,i was reading the hansolo YotaClock src file,i decided to build on it further for porting to my android phone,but i decided to try and build a Clock like chart just like that .
data here
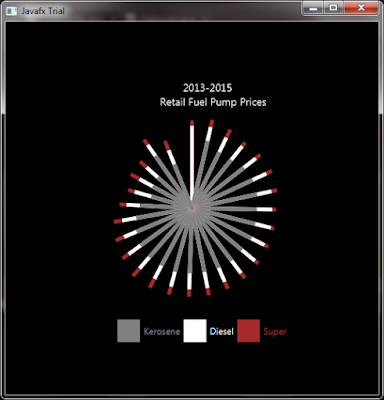

I changed the code a little bit to suite my data that's data from 27 days spread across 2013 to 2015,it reads clockwise and yes with less than 50 lines of code and some styling something beautiful appears.
I decided to add a Tooltip to show date and Price,the legend its a FlowPane with Rectangles and Labels
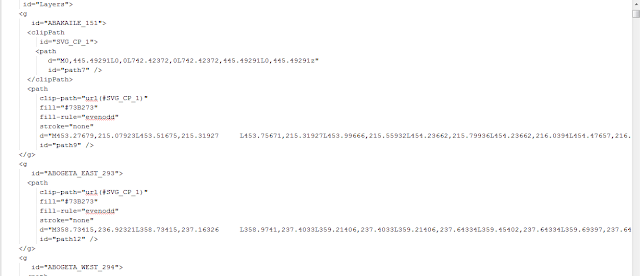
Drawing the lines
The angleStep is 13 (360/27) to fit all 27 records.
double size=500;
double sinValue;
double cosValue;
double startAngle= 180;
double angleStep = 360 / 27;//
Point2D center=new Point2D(size * 0.5, size * 0.5);
List<String> lines=FileReader.getLines();//size 27
for (double angle = 0, counter = 0; counter < 27 ; angle -=angleStep, counter++) {
sinValue = Math.sin(Math.toRadians(angle + startAngle));
cosValue = Math.cos(Math.toRadians(angle + startAngle));
Line line=new Line();
line.setStartX(center.getX());
line.setStartY(center.getY());
double line_length=//read data from file
double endX=center.getX()+(line_length)*sinValue;
double endY=center.getY()+(line_length)*cosValue;
line.setEndX(endX);
line.setEndY(endY);
getChildren().addAll(line);
}
Results

Comments
Post a Comment